Create Satellite Timelapse Animations in QGIS with OpenGeoAgent
The hardest part of a satellite timelapse is usually not the animation itself, it is finding the right location, the right time window, and the right satellite. The QGIS Timelapse plugin already removes most of the data engineering, and OpenGeoAgent now removes most of what is left. With a single text prompt or voice command, the agent picks the bounding box, picks the date range, calls the plugin, and renders an animation, often in less than a minute. In this tutorial, I show how to drive the workflow with natural language for several satellites and use cases, including hurricanes, volcanic eruptions, urban growth, irrigation, continental phenology, and high-resolution change.
Video tutorial: Satellite Timelapse Animations with OpenGeoAgent
What You Will Need
QGIS desktop (any standard installation works)
The Timelapse and OpenGeoAgent plugins from the official QGIS Plugin Repository
A Google Earth Engine account and a Google Cloud project ID
A ChatGPT subscription (recommended) for text prompts via the OpenAI Codex provider
An OpenAI API key only if you want voice dictation
Install the Plugins
Open Plugins > Manage and Install Plugins in QGIS and switch to the All tab.
Search for Timelapse and click Install Plugin (or Upgrade if you already have an older version).
Search for OpenGeoAgent and install it the same way.
Restart QGIS so both plugins load cleanly.
After the restart, the Timelapse and OpenGeoAgent menus appear in the QGIS menu bar.
Authenticate Earth Engine
The Timelapse plugin pulls Landsat, Sentinel, MODIS, and GOES data through Earth Engine, so you need to authenticate once.
Open Earth Engine in the QGIS menu and click Authenticate, then Initialize.
Enter your Google Cloud project ID. If you do not know it, look it up in the Earth Engine Code Editor.
Click Save Settings.
Configure OpenGeoAgent
Open OpenGeoAgent > Settings and switch to the Models tab.
Click Log in with ChatGPT to authenticate through the OpenAI Codex provider. This is the simplest path because billing is a flat monthly cost.
Optional: paste an OpenAI API key if you want voice dictation. The Codex provider does not support voice on its own.
Save settings.
Open OpenGeoAgent > Open Chat and configure the chat panel:
Provider: OpenAI Codex (or your OpenAI key if you prefer voice)
Agent mode: Timelapse
Permissions: Trust auto-approve so the agent can run the plugin without confirmation prompts
Voice dictation: press
Ctrl+Alt+Spaceto start and stop recording, thenCtrl+Enterto submit
You are ready to start prompting.
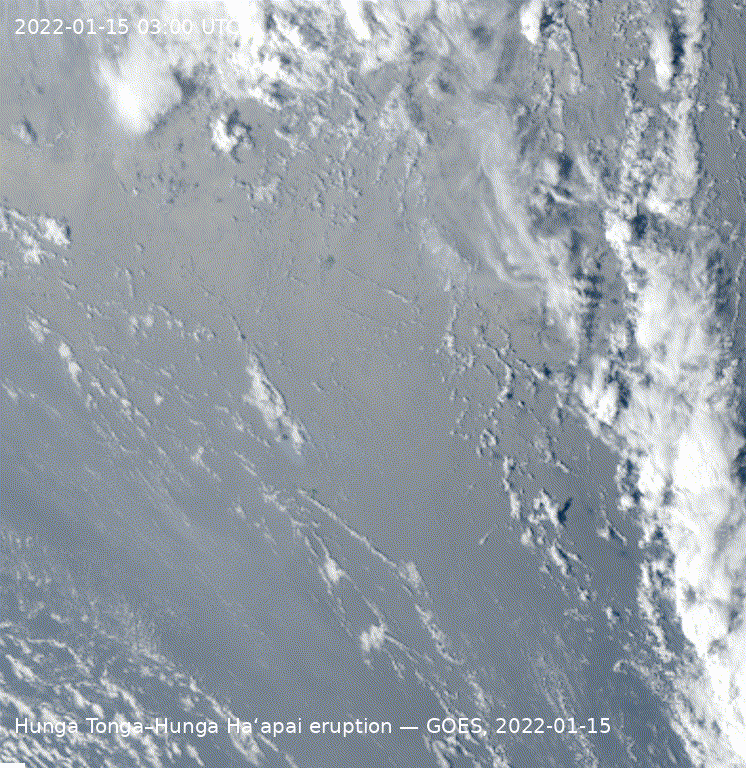
Example 1: GOES Timelapse of the Tonga Volcanic Eruption
GOES is a geostationary weather satellite with imagery every few minutes, which makes it ideal for fast-moving events. With voice or text, send:
Create a GOES timelapse of the Tonga volcanic eruption.
The agent identifies the eruption location, picks a sensible time window, and confirms its plan. Press y (or simply say yes) to run it. The animation renders in roughly 20 seconds and appears in the Timelapse panel with an auto-generated title and date overlay. Click Save Image to export the GIF or MP4 to disk.
Example 2: GOES Timelapse of Hurricane Erin (2025)
For named events, give the agent a year so it can target the right scenes:
Create a GOES timelapse of Hurricane Erin in 2025.
The agent finds the storm window (late August 2025 in this case) and asks whether to use the default time window. Reply yes. The animation may take 40 to 60 seconds because GOES has dense temporal coverage. If the storm appears small in the frame, follow up with:
Make the extent larger and recenter on the eye.
The agent regenerates the animation with the adjusted bounding box.
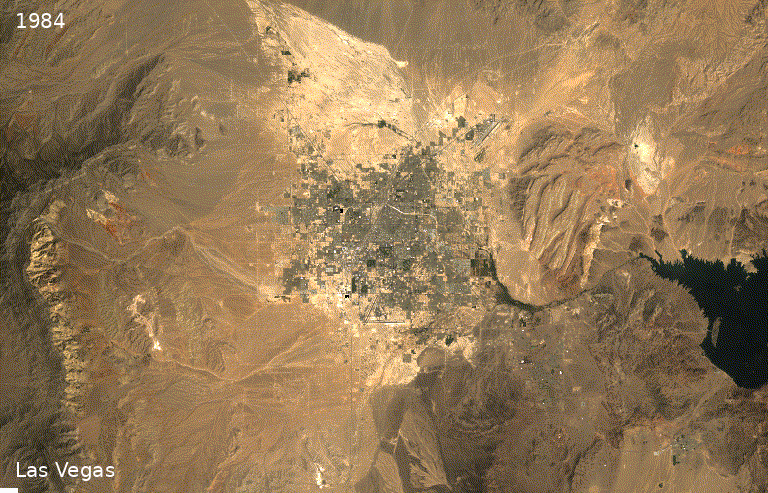
Example 3: Landsat Timelapse of Las Vegas (1986 to Present)
Landsat has more than four decades of archives, which is the right choice for long-term change. Pan the canvas to Las Vegas, then send:
Create a Landsat timelapse animation over Las Vegas from 1986 to the present.
The agent uses the Las Vegas extent it derives from the city name (or the current map extent if you ask for that), composites yearly Landsat imagery, and renders the animation in about a minute. The result is a striking visualization of urban growth into the surrounding desert.
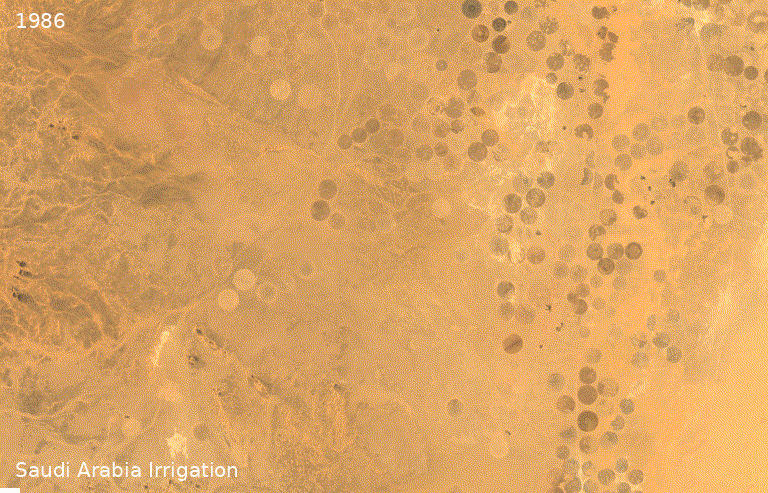
Example 4: Landsat Timelapse of Irrigation in Saudi Arabia
You do not have to know the location ahead of time. Ask the agent to recommend one:
Create a Landsat timelapse of a popular center pivot irrigation site in Saudi Arabia. Use a false color composite and title it “Irrigation, Saudi Arabia”.
The agent picks a representative site, applies a false color composite that highlights vegetation in red, and embeds the title in the animation. If the area is too small in the frame, draw a custom rectangle (see the Refine with Follow-up Prompts section below) and ask the agent to use the layer extent instead.
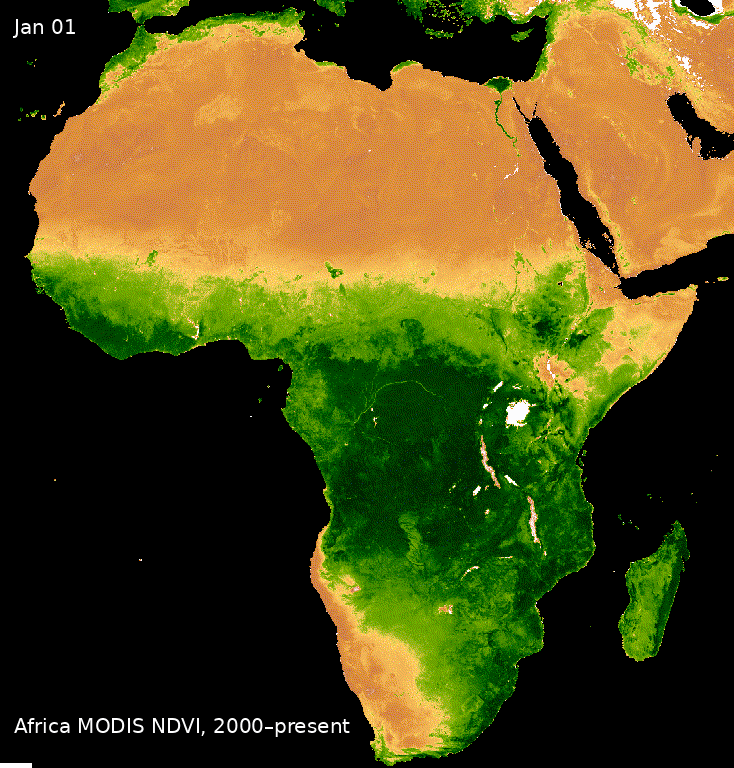
Example 5: MODIS NDVI Continental Timelapse over Africa
For continental-scale phenology, MODIS at 250 m is a better fit than Landsat. Send:
Create a MODIS NDVI timelapse animation over Africa.
In about 20 seconds the agent returns a continental animation that shows the seasonal green wave moving north and south with the rains. This kind of visual is hard to beat for a remote sensing lecture.
Example 6: Esri Wayback High-Resolution Timelapse
For sub-meter detail, switch to the Esri Wayback basemap archive by mentioning “Wayback” or “high resolution” in the prompt. Pan to a fast-changing neighborhood (for example, a new subdivision in Las Vegas) and send:
Create an Esri Wayback timelapse for the current extent. Use FPS 2 and title “Las Vegas”.
The agent fetches the historical Wayback layers, composites them in chronological order, and renders the animation. Wayback coverage starts in 2014, so it is best for recent change. If early years have incomplete tiles (visible as black areas), follow up with:
Use the current extent from 2018 to today.
Refine with Follow-up Prompts
The agent responds to plain-language refinements. Useful patterns include:
Smaller or larger extent: “Make the extent smaller and focus on the city center” or use a layer extent (see below).
Restrict the season: “Use data from June to September every year.” This is the most reliable way to dodge memory limits on long Landsat ranges.
Pick a year range: “Use data from 1992 to 2024” trims the front end of the archive when early years are sparse.
Frame rate: “Use FPS 2” for a slower playback, “Use FPS 5” for a faster one.
Title and color: “Title it ‘Aral Sea’” and “Use text color blue.”
Switch satellite: “Switch to Sentinel-2” or “Use MODIS NDVI instead.”
For a precise area of interest, draw a polygon and ask the agent to use it:
Layer > Create Layer > New Temporary Scratch Layer, geometry Polygon.
Enable View > Toolbars > Shape Digitizing Toolbar, then pick Add Rectangle from Center and a Point.
Click the canvas to draw the rectangle, right-click to finish.
Prompt: “Create a Landsat timelapse for the layer extent of the selected layer using a false color composite.”
The agent reads the active layer’s extent and uses it as the bounding box.
Tips
Memory limits: Long Landsat ranges over large areas often hit the Earth Engine memory ceiling. Either shrink the polygon, restrict the season (for example, June to August), or trim the year range.
Choosing a satellite: Landsat for multi-decade change, Sentinel-2 for finer spatial detail since 2015, MODIS for continental and weekly to monthly change, GOES for sub-hourly weather events, and Esri Wayback for sub-meter neighborhood-scale change since 2014.
Export: Click Save Image in the Timelapse panel to write the GIF, or check Create MP4 in the plugin’s Output tab if you need a video file for editing.
Iterate cheaply: Refining a prompt is faster than redrawing extents. If the first animation is not quite right, just describe what to change and resubmit.
Resources
GitHub repository: github
.com /opengeos /GeoAgent QGIS plugin homepage: geoagent
.gishub .org /qgis -plugin Companion post: OpenGeoAgent: An Open-Source Multimodal AI Agent
Companion post: Create Satellite Timelapse Animations in QGIS with Google Earth Engine
Video tutorial: youtu
.be /lT1qkIeEJTs
Try this on a place you care about: a hometown, a familiar coastline, a favorite national park, or a recent news event. The combination of natural language prompts and decades of free satellite data makes it trivial to produce striking visuals for class, research, or social media. If you run into issues or have feature requests, please open an issue on the GitHub repository, and subscribe on YouTube or follow the RSS feed to catch the next post when it is released.